Drag Coefficient of a Smooth Sphere
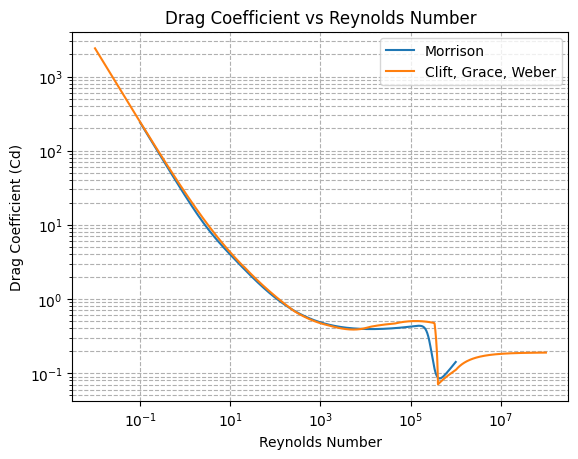
This notebook plots the drag coefficient of a smooth sphere as a function of the Reynold’s number for two different empirical correlations.
[1]:
import matplotlib.pyplot as plt
import numpy as np

from pytrebuchet.drag_coefficient import clift_grace_weber, morrison

# Calculate drag coefficient for a range of Reynold's numbers
reynolds_morrison = np.logspace(-1, 6, 1000)  # morrison valid from 0.1 to 1e6
reynolds_clift = np.logspace(-2, 8, 1200)
drag_coeff_morrison = morrison(reynolds_morrison)
drag_coeff_clift = clift_grace_weber(reynolds_clift)

# Plotting, both axes logarithmic
fig, ax = plt.subplots()
ax.loglog(reynolds_morrison, drag_coeff_morrison, label="Morrison")
ax.loglog(reynolds_clift, drag_coeff_clift, label="Clift, Grace, Weber")
ax.set_xlabel("Reynolds Number")
ax.set_ylabel("Drag Coefficient (Cd)")
ax.set_title("Drag Coefficient vs Reynolds Number")
ax.grid(True, which="both", ls="--")
ax.legend()
plt.show()